How to Read a Seed Germination Chart for Successful Planting
A seed germination chart provides key details on the percentage of seeds expected to sprout, ideal temperature ranges, and time frames for different plant seeds. Understanding how to read this chart is crucial to planning your planting schedule and achieving a healthy garden start.
These charts matter because they help gardeners predict germination success, optimize soil and environmental conditions, and reduce waste of seeds. Knowing which seeds need warmer soil or more time to break dormancy saves time and effort during the planting season.
In this article, we will explain the different components of a seed germination chart, including germination percentages, temperature preferences, and sowing depth recommendations. You’ll also find tips for interpreting variability and practical advice for using charts with common seed types.
Understanding Seed Germination Percentage and Its Implications

What Germination Percentage Represents
Germination percentage indicates the expected proportion of seeds that will successfully sprout under ideal conditions. For example, a 90% germination rate means that on average 9 out of 10 seeds should sprout when sown properly.
This percentage is vital for gardeners who want to estimate the number of seeds needed. Knowing this helps avoid under or overseeding and ensures you have enough plants without wasting excess seeds.
Factors Influencing Germination Rates
Several factors impact the germination success beyond the chart’s figure. Seed age, storage conditions, soil moisture, and temperature fluctuations can reduce actual germination rates compared to the chart’s prediction.
Understanding these elements helps interpret the chart with realistic expectations. For example, older seeds might have a lower germination rate despite the chart stating 85%-95%, so it's wise to increase seeding density in such cases.
- Storage temperature and humidity
- Seed viability over time
- Soil condition and moisture
- Plant species specific tolerance
Interpreting Temperature Guidelines on Seed Germination Charts
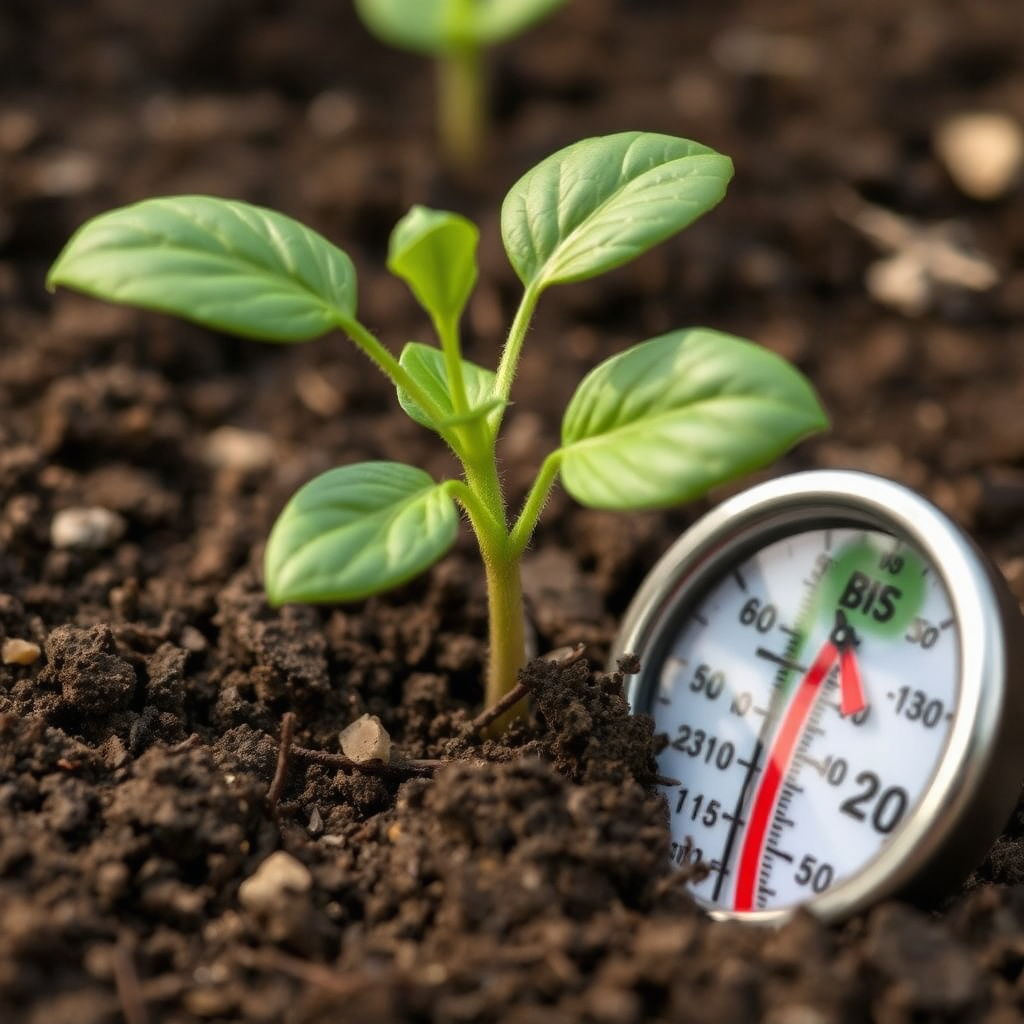
Optimal Temperature Ranges for Germination
Temperature is a critical factor presented in seed germination charts, usually as a range indicating the lowest and highest soil temperatures suitable for sprouting. Germination rates can drop sharply outside these ranges.
Warm-season crops like tomatoes require soil temperatures around 70°F-85°F, while cool-season plants like spinach can germinate at lower temperatures, around 45°F-75°F. Knowing these helps schedule planting during the best season.
For more on this, see our related guide: How to Read a Seed Catalog: A Complete Guide for Gardeners.
How Temperature Affects Germination Time
Higher temperatures within a seed’s acceptable range usually speed up germination, whereas colder temperatures slow the process. This affects how you interpret the time frames on the chart.
For instance, a seed chart might list germination time as 7-14 days, but near the lower temperature limit, germination could consistently take closer to 14 days or longer. Adjust your expectations accordingly when using the chart.
Reading Germination Time Frames and Scheduling Planting

Understanding Days to Germination
Seed germination charts often include a days-to-germinate range, which represents the average time between planting and sprout emergence under ideal conditions. This helps time planting schedules effectively.
Using this metric, gardeners can plan when to start seeds indoors or when to sow directly outside. For example, if a seed takes 10-14 days, you might start seeds two weeks before your expected last frost date indoors.
Accounting for Variability in Germination Times
Even under controlled conditions, germination times vary among seeds, influenced by environmental fluctuations and seed quality. The chart’s time frame often reflects this variability.
Gardeners should factor in buffer days beyond the maximum listed time to allow late sprouters. This avoids premature replanting, which can lead to overcrowding or wasted seeds.
- Add 2-3 extra days for slower seeds
- Monitor soil moisture regularly
- Avoid disturbing soil to check early
Navigating Additional Details on Seed Germination Charts
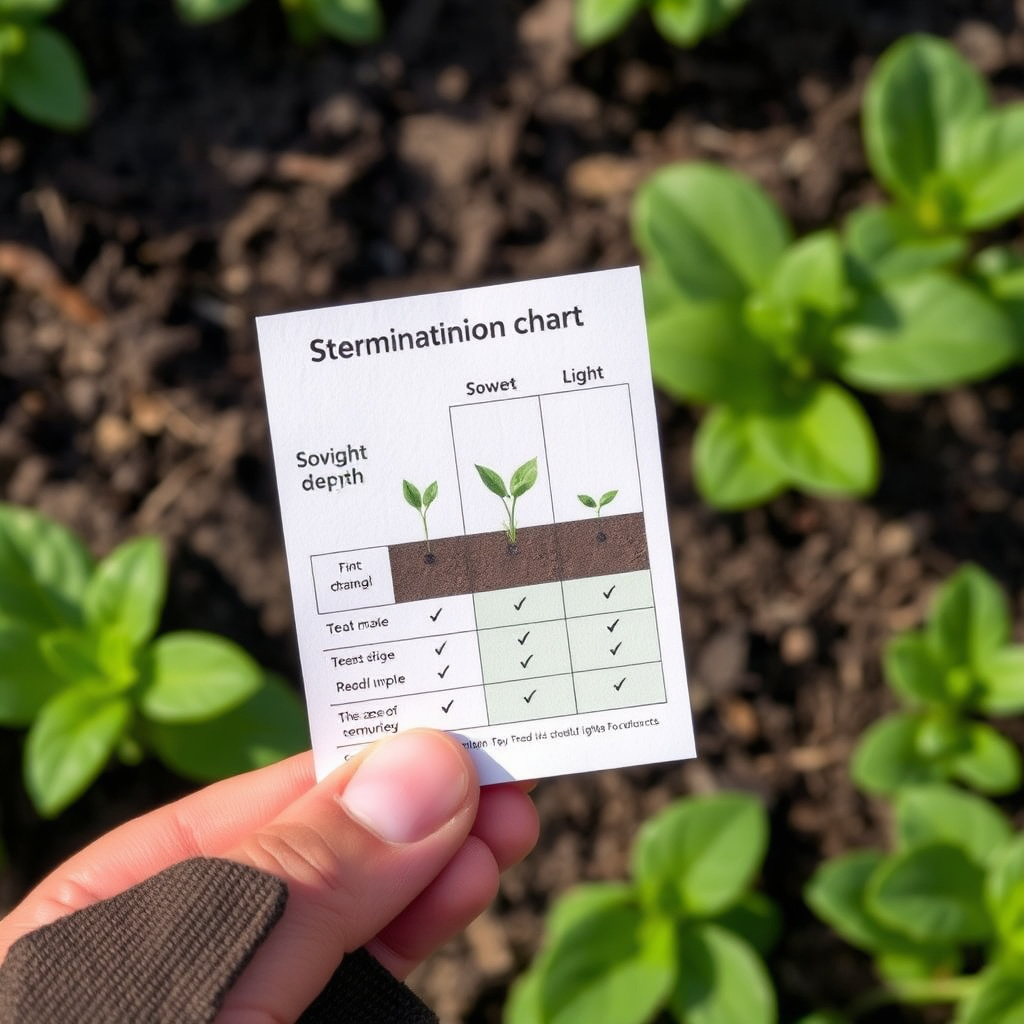
Sowing Depth Recommendations
Proper sowing depth is typically indicated on seed germination charts and influences successful sprouting. Planting too deep can prevent seeds from reaching the surface; too shallow can dry them out or expose them to predators.
As a general rule, seeds should be planted at a depth approximately twice their diameter. The chart specifies this depth in inches or centimeters for each seed type, helping achieve optimal emergence.
Light vs. Dark Germination Requirements
Some seeds require light to germinate, while others prefer darkness. Germination charts often note this detail as ‘light needed’ or ‘cover lightly’. Understanding this guides how you prepare seed trays or garden beds.
For seeds needing light, surface sowing or very shallow planting is recommended. For those requiring darkness, covering with soil or mulch to the advised depth encourages successful germination.
Practical Tips for Using Seed Germination Charts Effectively

Cross-Referencing Charts With Seed Packets
Seed packets can vary in detail; combining their information with germination charts offers the best guidance. Charts provide standardized data, while packets might offer brand-specific instructions.
Check both sources for planting depth, temperature, germination times, and rates. When discrepancies occur, default to the chart for consistent results, especially for less common seeds.
For a broader scientific perspective on seed germination, this Wikipedia page provides detailed explanations. Seed Germination on Wikipedia.
Adjusting Expectations According to Local Conditions
Local climate and soil conditions affect germination rates differently than chart conditions. Use the seed germination chart as a baseline, then adapt by observing how your garden environment behaves.
For example, seeds might take longer in cooler regions or where soil drains poorly. Modifying watering schedules and soil amendments can help approach the chart’s stated germination success rates.
- Test soil temperature before planting
- Modify watering based on weather
- Consider using seed mats or heaters
Seed Germination Chart Types Comparison
Here is a comparison of common seed germination charts based on format, detail level, and usability for different gardener needs.
| Chart Type | Format | Detail Included | Best For | Ease of Use |
|---|---|---|---|---|
| Basic Chart | Table with % and days | Germination rate, time | Beginners, quick reference | Very easy |
| Detailed Chart | Interactive/digital chart | Temperature, depth, light | Experienced gardeners | Moderate |
| Seed Catalog Charts | Printed booklet | Varies widely | Commercial growers | Variable |
| Mobile Apps | App-based | All parameters + reminders | Tech-savvy gardeners | Easy with learning curve |
Frequently Asked Questions
Can seed germination charts predict exact sprouting times?
No, charts provide average time ranges under ideal conditions. Actual germination can vary due to seed quality and environmental factors.
Why do some seeds have low germination percentages on charts?
Low percentages may reflect inherent seed viability issues or complex dormancy requirements specific to the plant species.
How should I adjust if my seeds take longer than the chart suggests?
Allow extra days beyond the chart estimates, check environmental conditions, and ensure proper moisture and temperature levels.
Are seed germination charts reliable for all seed types?
Charts are reliable for most common seeds but may not fully reflect rare or unusual species with special germination needs.
Do seed germination charts include information on soil pH?
Most charts focus on temperature, depth, and light; soil pH is rarely included but can be critical for some plants.
Key Takeaways
- Seed germination charts provide expected sprouting rates and time frames to help plan planting.
- Temperature and sowing depth are critical factors often detailed in these charts.
- Charts should be used as guidelines, adjusted for local conditions and seed quality.
- Understanding chart details prevents wasted seeds and supports better garden outcomes.
Conclusion
Reading a seed germination chart effectively requires understanding its key components: germination percentages, recommended temperature ranges, time frames, and sowing depths. Combining this knowledge with awareness of local conditions allows gardeners to make informed choices rather than guessing. The charts act as a roadmap but flexibility and observation remain essential for success.
For gardeners starting seeds indoors or sowing directly, paying close attention to temperature guidelines on seed germination charts can improve sprouting rates. Warm-season vegetables like peppers and tomatoes thrive at higher soil temperatures, while cool-season crops like lettuce and spinach require cooler soil. Additionally, adjusting seeding density according to germination rates prevents overcrowding and minimizes waste. Using detailed germination charts along with seed packet instructions ensures more predictable results.
To begin applying this information, start by selecting a reliable seed germination chart matching your plant varieties. Record your local soil temperature and adjust your planting schedule accordingly. Monitor moisture carefully, follow recommended sowing depths, and give seedlings time to emerge without disturbance. With practice, interpreting seed germination charts will become a natural part of your gardening routine that leads to healthier plants and greater satisfaction.